Observability Overview
The StarlingX OpenStack application provides observability capabilities that give you
visibility into the health, performance, and operational state of your cloud.
With components such as the Ceilometer exporters, OpenStack Exporter, Aodh
services, and the optional prometheus platform application, you can collect
and store metrics, process service events, evaluate alarms, and expose
telemetry data to monitoring and analytics systems.
Key Components of the Observability Stack
The following table serves as a reference for the major observability components and their operational characteristics.
Component |
Chart |
Namespace |
Purpose |
Consumed By |
Default |
How to Change |
|---|---|---|---|---|---|---|
Ceilometer Central Exporter |
|
|
Collects metrics from OpenStack services. |
Prometheus server and external monitoring systems. |
Enabled |
Modify the Ceilometer Helm overrides and reapply the application. |
Ceilometer Compute Exporter |
|
|
Collects metrics from compute hosts and hypervisors. |
Prometheus server and external monitoring systems. |
Enabled |
Modify the Ceilometer Helm overrides and reapply the application. |
Ceilometer Notification Agent |
|
|
Processes OpenStack notifications and generates events for alarm evaluation. |
Aodh event-based alarms. |
Enabled |
Modify the Ceilometer Helm overrides and reapply the application. |
OpenStack Exporter |
|
|
Exposes cloud-wide metrics collected from OpenStack APIs. |
External monitoring systems. |
Disabled |
Enable the exporter through the Helm chart overrides and reapply the application. |
Prometheus platform application |
|
|
Collects and stores metrics from the Ceilometer exporters and provides query capabilities for metric-based alarms. |
Aodh alarm evaluator and external monitoring tools. |
Uploaded, not applied |
Apply the Prometheus application. |
Aodh services (API, evaluator, listener, notifier) |
|
|
Evaluates metric-based and event-based alarm conditions and executes alarm actions. |
Operators and external notification endpoints. |
Enabled |
Modify the Aodh Helm overrides and reapply the application. |
Architecture
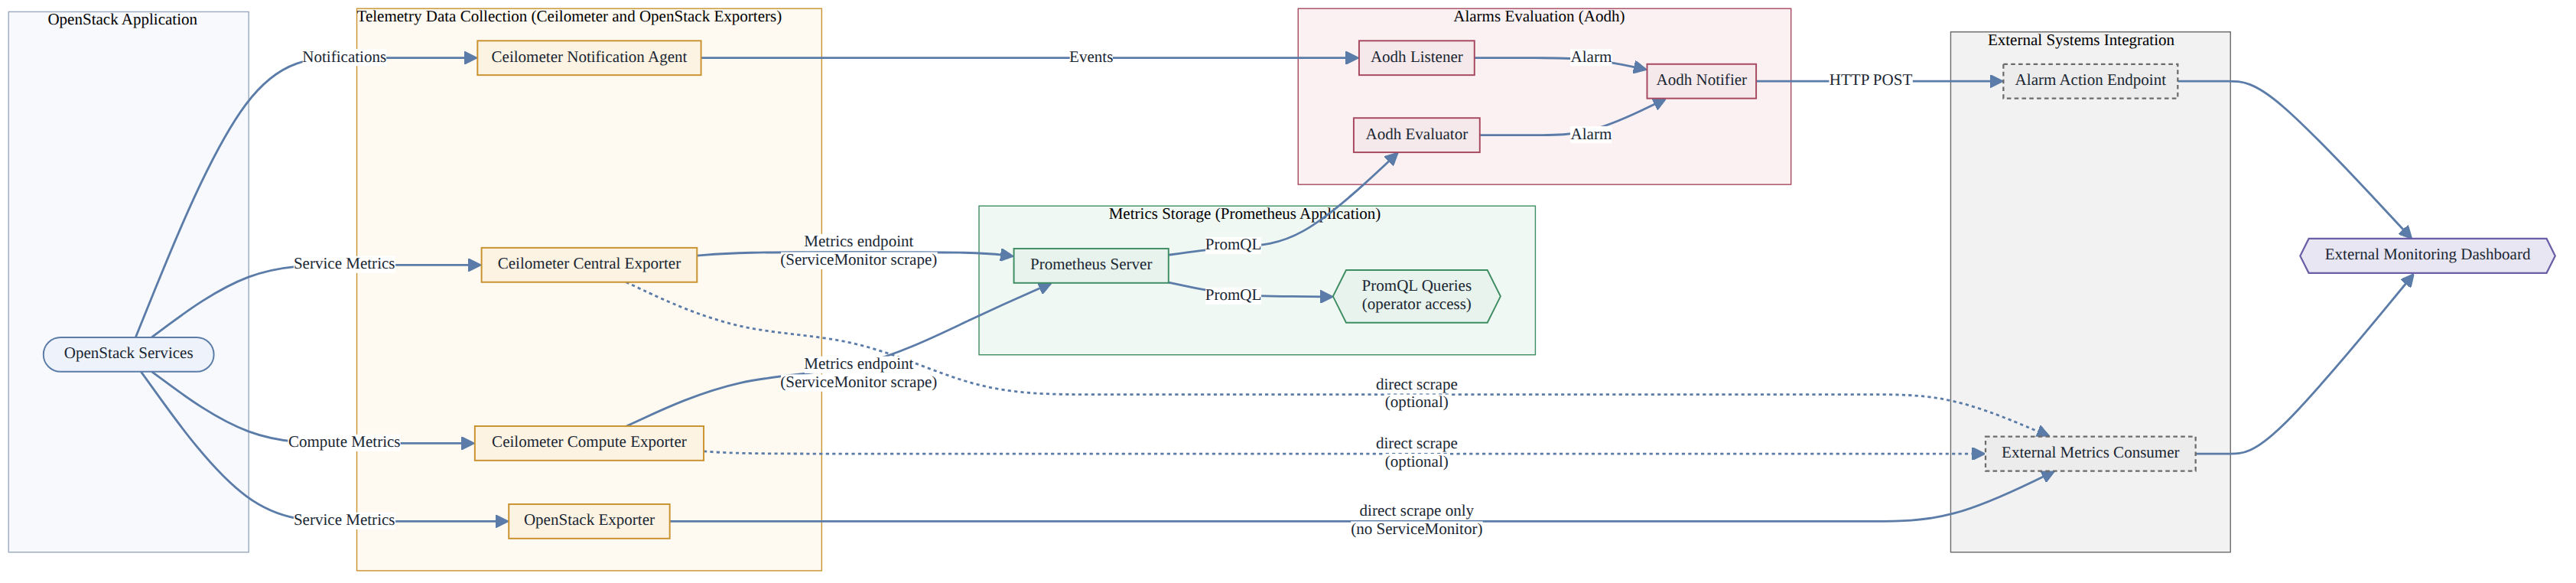
The observability stack consists of the following frameworks:
Metrics Framework: Collects and stores metrics from OpenStack services to support monitoring, visualization, and metric-based alarm evaluation. For more information, see Metrics Framework.
Event Alarm Framework: Processes OpenStack service notifications and evaluates event-based alarms. Events flow from OpenStack service notifications through RabbitMQ and the Ceilometer Notification Agent, and are then evaluated by the
aodh-listenerservice for event-based alarms. For more information, see Event Alarm Framework.
These frameworks operate independently. If you only require event-based alarm
functionality, you do not need to deploy the prometheus application.
Similarly, metric-based alarms can be configured and evaluated without using
OpenStack service notifications or events.
The common integration point between the two frameworks is the Aodh API, which is used to create, manage, and query alarm definitions.
Metrics Framework
The Metrics Framework includes the following exporters, which collect and expose metrics in Prometheus format:
Ceilometer Central Exporter collects metrics by polling OpenStack service APIs, such as Nova, Neutron, Glance, and Cinder. These metrics provide visibility into the state and resource usage of OpenStack services. Metrics are exposed on port
9101through the Serviceosh-openstack-ceilometer-central.Ceilometer Compute Exporter collects metrics from the local hypervisor on each compute host, providing visibility into compute node and instance resource usage. Metrics are exposed on port
9101through the Serviceosh-openstack-ceilometer-compute. This service is configured withinternalTrafficPolicy: Localand responds only on the node where the corresponding exporter is running.OpenStack Exporter collects inventory and status information from OpenStack services, including resources such as instances, hypervisors, networks, ports, images, volumes, and stacks. It polls the OpenStack APIs at a configurable polling interval (default: 30 seconds) and publishes metrics in Prometheus format intended for external monitoring or analytics systems (not collected by the
prometheusplatform application). Metrics are exposed on port9180through the Serviceopenstack-metrics.
The prometheus platform application discovers these exporters through
ServiceMonitor resources, collects their metrics on a fixed interval, and
stores the metrics in its time-series database (TSDB). The aodh-evaluator
service then queries the stored metrics to evaluate metric-based alarms.
For more information, see Configure OpenStack Exporter for Metrics Collection.
Note
Metric-based alarms require the prometheus platform application. For
details on the exporters, ServiceMonitors, and collection intervals, see
Configure Ceilometer for Telemetry Data Collection.
Event Alarm Framework
The Event Alarm Framework enables alarms to be triggered by OpenStack service events.
OpenStack services publish notifications to RabbitMQ when operational events
occur. The Ceilometer Notification Agent converts these notifications into
Ceilometer events, and the aodh-listener service evaluates the events
against event-based alarms. When an alarm changes state, the aodh-notifier
service sends a notification to the configured alarm action endpoint over HTTP
or HTTPS.
Because this path does not involve the Prometheus server, event-based alarms
work even when the prometheus platform application is not applied.
Note
For details on creating event-based alarms, configuring notification endpoints, and event trait filtering, see Manage Alarms Using Aodh.
Observability Key Workflows and Tasks
The following table provides an overview of the key observability workflows and the corresponding sections in this document.
Step |
Area |
Description |
Section |
|---|---|---|---|
1 |
Telemetry Collection (Ceilometer) |
Configure the Ceilometer central and compute agents to collect and expose metrics from OpenStack services and compute hosts. |
|
2 |
Metrics Storage (Prometheus) |
Deploy and configure the |
|
3 |
Alarm Management (Aodh) |
Create and manage metric-based and event-based alarms. Aodh evaluates alarm conditions and triggers notifications to configured endpoints. |
|
4 |
External Integration |
Expose telemetry endpoints and forward alarm notifications to external monitoring or analytics systems, including the OpenStack Exporter. |
