Data Network Topology View
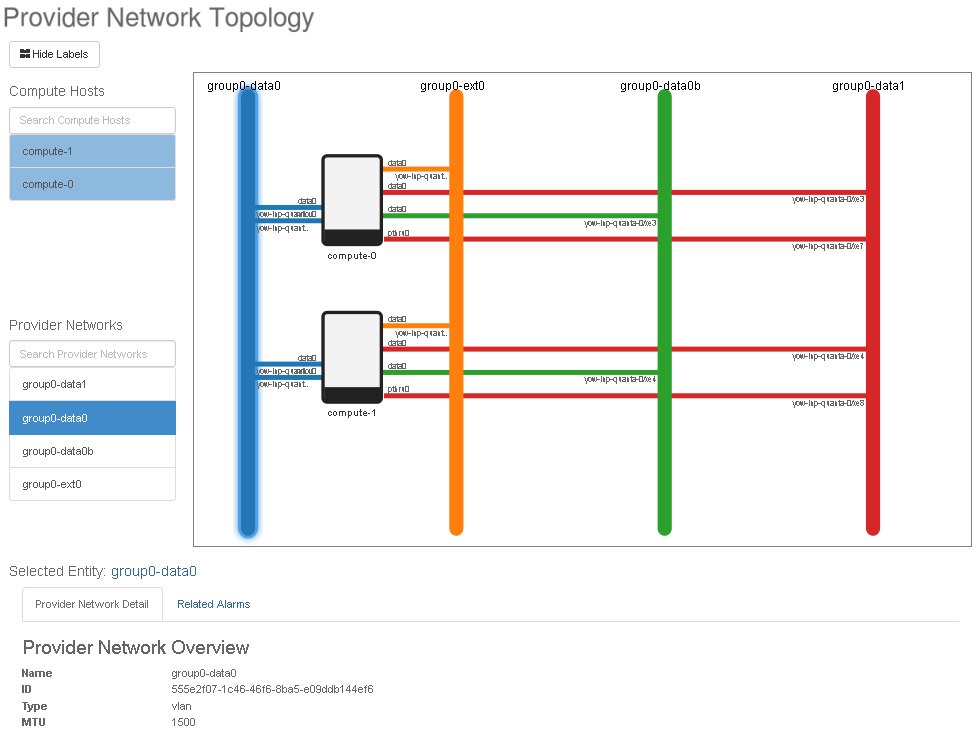
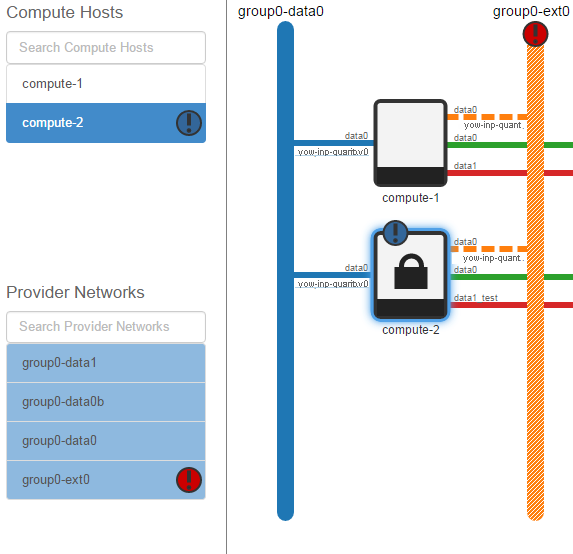
The Data Network Topology view shows data networks and compute host data interface connections for the system using a color-coded graphical display. Active alarm information is also shown in real time. You can select individual hosts or networks to highlight their connections and obtain more details.
To display this view, select Admin > Platform > Data Network Topology.

Additional Details for Entities
When you select an entity, associated entities are highlighted in the Worker Hosts list or the Data Networks list. For example, if you select the group0-data0 data network, all hosts attached to it are highlighted in the Worker Hosts list.
Additional information for the selected entity is available in tabbed pages below the topology window.
For a worker host, the additional information includes the Overview, Interfaces, and LLDP tabs from the Host Detail, as well as a Related Alarms tab that lists any active alarms associated with the host.
For a data network, the additional information includes the Data Network Detail tab from the Data Network Overview, and a Related Alarms tab that lists any active alarms associated with the data network.
Alarm Reporting
Active alarms for entities are displayed in real time in the topology window, using icons superimposed on the entities. The alarms are color-coded for severity using the same colors as the Global Alarm Banner. Details for the alarms are listed in the Related Alarms tab for the entity.

Labels for Network Connections
Network connections in the topology window may be labeled with the data interface name (displayed above the connection line) and LLDP neighbor information (displayed below the connection line). You can show or hide the labels using a button above the lists (Show Labels or Hide Labels).
